

What Will You Learn?
By the end of this lesson, you will be able to:
- Understand why AI models need to be evaluated before deployment
- Explain True Positive, False Positive, True Negative, and False Negative
- Calculate accuracy and other performance metrics
- Interpret a confusion matrix
- Understand when accuracy alone isn’t enough
Imagine a smoke detector in your house. It has one job: alert you when there’s a fire.
But what if it goes off every time you make toast? That’s annoying. Right?
And what if it stays silent during an actual fire? That’s dangerous!
AI models face the same challenge. They can be wrong in different ways, and some errors are worse than others.
This is why Evaluation is necessary. To measure how well an AI model performs on data that it has never seen (test data), and understand what types of mistakes it makes. A model that’s 90% accurate might still be terrible if its 10% errors are all life-threatening mistakes.
Let’s learn how to properly evaluate AI models.
What is Evaluation?
Evaluation is the fifth stage of the AI Project Cycle where we:
- Test the trained model with data it hasn’t seen before
- Measure how often the model is correct
- Understand what types of errors it makes
- Decide if the model is good enough for deployment
- Identify areas for improvement
💡 Key Insight
A model that performs well on training data might fail on new data. Evaluation tests real-world readiness.
Why is Evaluation Important?
| Without Evaluation | With Evaluation |
|---|---|
| Deploy a broken model | Know exactly how well the model performs |
| Discover problems after release | Find issues before users are affected |
| No way to compare approaches | Choose the best model systematically |
| Unknown failure modes | Understand where the model struggles |
| Overconfident predictions | Calibrated expectations |
Real Example:
An AI to detect diabetic eye disease might be 95% accurate overall. But evaluation reveals:
- For severe cases: 99% correct (great!)
- For mild cases: 70% correct (needs improvement)
Without detailed evaluation, you can assume the model is ready. With evaluation, you know to improve mild case detection before deployment.
Understanding Predictions: The Basics
The output or answer that the AI model produces after learning from data is called prediction. It is the model’s best guess about the output for the given input. Evaluating these predictions helps you check how accurate and reliable the model is.
Before diving into evaluation metrics, let’s understand what AI predictions look like.
Classification
In AI prediction, a class is a category or label that the model assigns to an input. For example, if an AI is identifying animals in images, the classes might be “cat,” “dog,” or “bird.” When the model predicts, it decides which class the new data belongs to.
Most AI evaluation focuses on yes/no predictions (called binary classification):
| Prediction Task | Class 1 | Class 2 |
|---|---|---|
| Email filtering | Spam | Not Spam |
| Disease screening | Disease Present | Healthy |
| Fraud detection | Fraudulent | Legitimate |
| Quality control | Defective | Good |
For each prediction, the AI can be:
- Correct — Prediction matches reality
- Wrong — Prediction doesn’t match reality
But wait — there are two ways to be correct and two ways to be wrong! Yeah, everything in computers is binary.
The Four Outcomes: TP, FP, TN, FN
This is the most important concept in AI evaluation. Every prediction falls into one of these four categories.
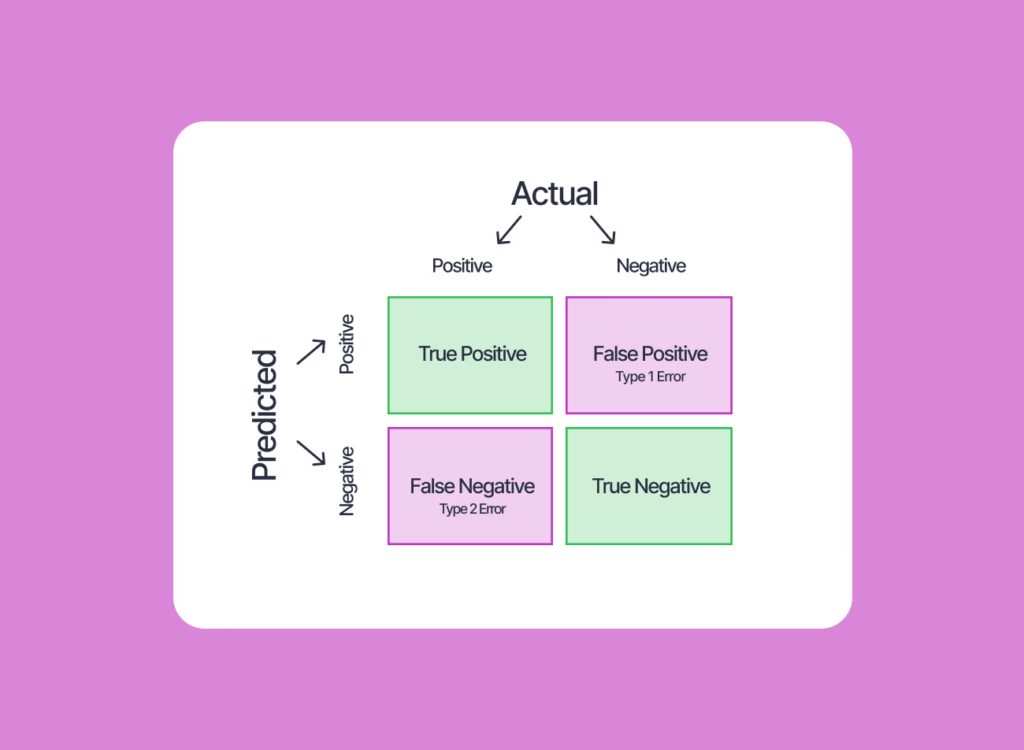
How to read this:
- True/False = Was the prediction correct?
- Positive/Negative = What did the AI predict?
| Prediction Correct | Prediction Wrong | |
|---|---|---|
| AI Predicted Positive | True Positive | False Positive |
| AI Predicted Negative | True Negative | False Negative |
🧪 Think About It
For a smoke detector:
- TP = Alarm goes off when there’s a real fire
- TN = Alarm stays silent when there’s no fire
- FP = Alarm goes off for toast (false alarm)
- FN = Alarm stays silent during a real fire (dangerous!)
Definitions
| Outcome | Definition | Spam Example |
|---|---|---|
| True Positive (TP) | AI said YES, and it was correct | Detected a spam email correctly |
| True Negative (TN) | AI said NO, and it was correct | Allowed a legitimate email correctly |
| False Positive (FP) | AI said YES, but it was wrong | Blocked a legitimate email (false alarm) |
| False Negative (FN) | AI said NO, but it was wrong | Let a spam email through (missed detection) |
AI Detecting Spam Emails
| AI Says “SPAM” | AI Says “NOT SPAM” | |
|---|---|---|
| Actually SPAM | ✓ True Positive (TP) | ✗ False Negative (FN) |
| Actually NOT SPAM | ✗ False Positive (FP) | ✓ True Negative (TN) |
The Confusion Matrix
A confusion matrix is a table that shows all four outcomes at once. It gives you an idea how well an AI classification model performed by comparing actual classes with the model’s predicted classes. Each cell in the table tells you whether the model predicted correctly or made specific types of mistakes.
Example: Spam Detection Evaluation
We tested our AI on 100 emails (60 were spam, 40 were legitimate).
| Predicted SPAM | Predicted NOT SPAM | Total | |
|---|---|---|---|
| Actual SPAM | 50 (TP) | 10 (FN) | 60 |
| Actual NOT SPAM | 5 (FP) | 35 (TN) | 40 |
| Total | 55 | 45 | 100 |
Reading the matrix:
- 50 spam emails were correctly identified (True Positives)
- 10 spam emails were missed (False Negatives)
- 5 legitimate emails were wrongly marked as spam (False Positives)
- 35 legitimate emails were correctly allowed (True Negatives)
Calculating Model Accuracy
Accuracy is the simplest performance metric:
Accuracy = (Correct Predictions) / (Total Predictions)
         = (TP + TN) / (TP + TN + FP + FN)
Using Our Spam Example:
Accuracy = (50 + 35) / (50 + 35 + 5 + 10)
         = 85 / 100
         = 0.85 or 85%
The model is 85% accurate. Is that good enough? You need to decide that basedon what it will be used for.
When Accuracy Isn’t Enough
Here’s the problem with accuracy: it can be misleading when data is unbalanced.
Example: Disease Detection
Imagine testing for a rare disease that affects 1 in 1000 people.
Scenario: 1000 patients, only 1 has the disease.
Terrible AI that just says “No disease” every time:
| Predicted Disease | Predicted Healthy | |
|---|---|---|
| Actually Has Disease | 0 (TP) | 1 (FN) |
| Actually Healthy | 0 (FP) | 999 (TN) |
Accuracy = (0 + 999) / 1000 = 99.9%99.9% accurate! But this AI is useless because it missed the one person who actually needed help!
This is why we need additional metrics.
Other Important Metrics
Precision
Question: Of all the positives the AI predicted, how many were actually correct?
Precision = TP / (TP + FP)Spam Example: 50 / (50 + 5) = 50/55 = 90.9%
Meaning: When the AI says “spam,” it’s correct 90.9% of the time.
Recall (Sensitivity)
Question: Of all the actual positives, how many did the AI catch?
Recall = TP / (TP + FN)Spam Example: 50 / (50 + 10) = 50/60 = 83.3%
Meaning: The AI catches 83.3% of all spam emails.
F1 Score
Question: What’s the balance between Precision and Recall?
F1 Score = 2 × (Precision × Recall) / (Precision + Recall)

Note: You cannot use percentage here for Precision and Recall calues; only the absolute values you calculated earlier.
Spam Example: 2 × (0.909 × 0.833) / (0.909 + 0.833) = 87.0%
F1 Score gives a single number that balances both concerns.
ROC Curve and AUC
Question: How does the model perform across all possible decision thresholds?
When an AI model classifies something — say, whether an email is spam — it doesn’t just say “yes” or “no” directly. It produces a probability score: “This email is 0.87 likely to be spam.” You then set a threshold: if the score is above 0.5, call it spam.
But what if you raise that threshold to 0.8? You’d call fewer emails spam — catching less spam (lower Recall) but also making fewer false alarms (higher Precision). Lower the threshold to 0.3 and you’d catch almost all spam but also block a lot of legitimate email.
The ROC Curve (Receiver Operating Characteristic Curve) shows how the model performs at every possible threshold, not just one. It plots:
- Y-axis: True Positive Rate (= Recall) — how many actual positives were caught
- X-axis: False Positive Rate — how many negatives were incorrectly flagged as positive
True Positive Rate
(Recall)
1.0 │    ╭─────────────
    │   ╱
    │  ╱
0.5 │ ╱
    │╱   Random (AUC = 0.5)
0.0 └───────────────────
    0.0       0.5      1.0
         False Positive Rate
A perfect model hugs the top-left corner (catches all positives with zero false alarms). A random model follows the diagonal line.
AUC — Area Under the Curve
The area under the ROC curve (called AUC or AUC-ROC) gives a single number to summarise model performance across all thresholds:
| AUC Value | What It Means |
|---|---|
| 1.0 | Perfect model — catches all positives with no false alarms |
| 0.9 – 0.99 | Excellent performance |
| 0.7 – 0.89 | Good performance |
| 0.5 | No better than random guessing |
| Below 0.5 | Worse than random — predictions are inverted |
Why AUC matters: While Accuracy, Precision, Recall, and F1 all assume you’ve already picked a threshold, AUC evaluates the model’s overall ability to distinguish between classes, independent of any threshold. It is especially useful when comparing two different models to decide which one is fundamentally stronger.
💡 Key Insight
The ROC curve is most useful when you need to understand the full range of trade-offs before choosing a deployment threshold. For example, a hospital might use an ROC curve to find the exact threshold at which the AI catches 98% of disease cases before deciding what false alarm rate they are willing to accept.
Which Metric Matters Most?
It depends on the consequences of each error type:
| Situation | Worse Error | Focus On |
|---|---|---|
| Spam filter | Blocking legitimate email (FP) | High Precision |
| Disease screening | Missing a sick patient (FN) | High Recall |
| Fraud detection | Missing fraud (FN) | High Recall |
| Self-driving car brake | Not stopping (FN) | Extremely High Recall |
| Legal system | Convicting innocent (FP) | High Precision |
Remember:
- High Precision = Be very sure before saying “Yes”
- High Recall = Don’t miss any actual positives
There’s usually a trade-off between the two. Making AI more cautious (higher precision) often means missing more cases (lower recall).
The Evaluation Process
Now that we have understood the evaluation metrics, let us get back to the AI model evaluation process.
Step 1. Split Your Data: Don’t test on data the AI has already seen! Use:
- Training data (70-80%): Used to train the model
- Test data (20-30%): Kept separate for evaluation
Step 2. Make Predictions: Run the trained model on test data.
Step 3. Compare to Reality: Count TP, TN, FP, FN.
Step 4. Calculate Metrics: Compute accuracy, precision, recall, F1.
Step 5. Analyze Errors: Look at specific mistakes. Are there patterns? Certain categories worse than others?
Step 6. Decide: Based on your analysis, decide if the performance is good enough. If not, you need to go back to earlier stages depending on the reason behind poor evaluation score:
- More data? → Data Acquisition
- Better features? → Data Exploration
- Different model? → Modelling
Activity: Calculate the Metrics
An AI for detecting defective products was tested on 200 items. Here are the results:
| Predicted Defective | Predicted Good | Total | |
|---|---|---|---|
| Actually Defective | 30 | 10 | 40 |
| Actually Good | 20 | 140 | 160 |
| Total | 50 | 150 | 200 |
Calculate:
- TP, TN, FP, FN = ?
- Accuracy = ?
- Precision = ?
- Recall = ?
(Answers in Answer Key)
Real-World Case Study: Aravind Eye Hospital
The diabetic retinopathy AI from Aravind Eye Hospital underwent rigorous evaluation. Here is the test setup:
- Test images separate from training
- Expert ophthalmologists provided ground truth labels
- Multiple severity levels tested
Results:
| Metric | AI Performance |
|---|---|
| Sensitivity (Recall) for referable DR | 97.5% |
| Specificity (TN Rate) | 96.1% |
| Agreement with experts | 98.6% |
What this means:
- 97.5% of people with referable disease were correctly identified
- 96.1% of healthy people were correctly cleared
- AI matched expert doctors’ decisions 98.6% of the time
Why high Recall mattered: Missing someone with eye disease could lead to blindness. The AI was tuned for high recall — catch everyone who needs treatment.
Common Evaluation Mistakes
Here are some common mistakes made by the evaluators.
| Mistake | Why It’s Wrong | How to Fix |
|---|---|---|
| Testing on training data | Model memorizes answers, not patterns | Keep test data completely separate |
| Only checking accuracy | Hides important error patterns | Use precision, recall, confusion matrix |
| Ignoring rare cases | Model might fail on important minorities | Stratified sampling, check each class |
| One-time evaluation | Performance varies | Cross-validation, multiple tests |
| No baseline comparison | Don’t know if improvement | Compare to simple benchmarks |
Quick Recap
- Evaluation is the fifth stage where we test if the model actually works.
- Predictions can be True Positive, True Negative, False Positive, or False Negative.
- A confusion matrix shows all four outcomes in a table.
- Accuracy = (TP + TN) / Total — but can be misleading with unbalanced data.
- Precision = TP / (TP + FP) — of all predicted positives, how many were right?
- Recall = TP / (TP + FN) — of all actual positives, how many were caught?
- F1 Score balances precision and recall.
- Different applications prioritize different metrics based on error consequences.
- Always test on data the model hasn’t seen during training.
- If performance is poor, iterate back to earlier stages.
Next Lesson: AI Deployment: How to Launch and Use Your AI Solution in Real Life
Previous Lesson: AI Modelling Explained: Rule-Based vs Learning-Based Approach (With Examples)
EXERCISES
A. Fill in the Blanks
- Evaluation is the __ stage of the AI Project Cycle.
- TP stands for True __.
- FP stands for __ Positive.
- When AI predicts spam and the email is actually spam, it’s a True __.
- When AI predicts healthy but the person is sick, it’s a False __.
- A __ matrix shows all four outcomes (TP, TN, FP, FN) in a table.
- Accuracy = (TP + TN) / __.
- Precision measures how many predicted positives were __ correct.
- __ measures how many actual positives were caught.
- For disease detection, high __ is crucial to not miss sick patients.
B. Multiple Choice Questions
1. Which stage of the AI Project Cycle is Evaluation?
(a) Third
(b) Fourth
(c) Fifth
(d) Sixth
2. A False Positive occurs when:
(a) AI says Yes and it’s correct
(b) AI says Yes but it’s wrong
(c) AI says No and it’s correct
(d) AI says No but it’s wrong
3. If a spam filter marks a legitimate email as spam, that’s a:
(a) True Positive
(b) True Negative
(c) False Positive
(d) False Negative
4. If accuracy is 90%, it means:
(a) 90% of predictions are wrong
(b) 90% of predictions are correct
(c) 90% of positives are correct
(d) The model is perfect
5. Precision is calculated as:
(a) TP / (TP + FN)
(b) TP / (TP + FP)
(c) (TP + TN) / Total
(d) TN / (TN + FP)
6. Recall is calculated as:
(a) TP / (TP + FN)
(b) TP / (TP + FP)
(c) (TP + TN) / Total
(d) TN / (TN + FP)
7. For medical diagnosis, which error is most dangerous?
(a) False Positive (healthy person told they’re sick)
(b) False Negative (sick person told they’re healthy)
(c) True Positive
(d) True Negative
8. In the Aravind Eye Hospital study, why was high recall important?
(a) To save money
(b) To not miss patients with eye disease
(c) To reduce false alarms
(d) To increase accuracy
9. Why should you test on data the model hasn’t seen?
(a) To make the model look better
(b) To truly test generalization to new cases
(c) To confuse the model
(d) It doesn’t matter
10. What should you do if evaluation shows poor performance?
(a) Deploy anyway
(b) Give up
(c) Go back to earlier stages and improve
(d) Just increase accuracy numbers manually
C. True or False
- Evaluation comes before Modelling in the AI Project Cycle. (__)
- A True Negative means the AI correctly predicted “No.” (__)
- False Positive and False Negative are both types of correct predictions. (__)
- High accuracy always means the model is good. (__)
- Precision focuses on predicted positives. (__)
- Recall focuses on actual positives. (__)
- F1 Score combines Precision and Recall. (__)
- For fraud detection, missing fraud (FN) is usually worse than false alarms (FP). (__)
- You should test AI models on their training data. (__)
- The Aravind AI achieved over 95% sensitivity for detecting eye disease. (__)
D. Define the Following (30-40 words each)
- Evaluation (in AI)
- True Positive
- False Positive
- True Negative
- False Negative
- Accuracy
- Confusion Matrix
E. Very Short Answer Questions (40-50 words each)
- What is Evaluation and why is it important?
- Explain True Positive and False Positive with an example.
- Explain True Negative and False Negative with an example.
- What is a confusion matrix? What does it show?
- How do you calculate accuracy? What are its limitations?
- What is Precision and when is it important?
- What is Recall and when is it important?
- Why might 99% accuracy still mean a bad model?
- What is the difference between Precision and Recall?
- What should you do if evaluation shows poor results?
F. Long Answer Questions (75-100 words each)
- Explain True Positive, True Negative, False Positive, and False Negative with a spam detection example.
- A model tested on 100 cases had 40 TP, 30 TN, 10 FP, and 20 FN. Calculate accuracy, precision, and recall.
- Why is accuracy alone not enough? Explain with an example of unbalanced data.
- Compare when you would prioritize Precision vs Recall with examples.
- Describe the evaluation process step by step.
- Explain the evaluation results of the Aravind Eye Hospital AI and why those specific metrics mattered.
- What are common mistakes in AI evaluation and how can they be avoided?
ANSWER KEY
A. Fill in the Blanks – Answers
- fifth — Evaluation is the fifth stage.
- Positive — True Positive.
- False — False Positive.
- Positive — Correct prediction of spam is TP.
- Negative — Missed sick person is FN.
- confusion — Confusion matrix displays all outcomes.
- Total — Accuracy = (TP + TN) / Total predictions.
- actually — Precision measures correct positives among predicted positives.
- Recall — Recall measures how many actual positives were detected.
- Recall — High recall ensures sick patients aren’t missed.
B. Multiple Choice Questions – Answers
- (c) Fifth — Evaluation is the fifth stage.
- (b) AI says Yes but it’s wrong — FP is incorrect positive prediction.
- (c) False Positive — Legitimate email wrongly marked as spam.
- (b) 90% of predictions are correct — Accuracy measures overall correctness.
- (b) TP / (TP + FP) — Precision formula.
- (a) TP / (TP + FN) — Recall formula.
- (b) False Negative — Missing a sick person is dangerous.
- (b) To not miss patients with eye disease — High recall catches all cases.
- (b) To truly test generalization — Testing on training data gives false confidence.
- (c) Go back to earlier stages and improve — Iterate to improve the model.
C. True or False – Answers
- False — Evaluation comes AFTER Modelling.
- True — TN = correctly predicted negative.
- False — Both are INCORRECT predictions.
- False — High accuracy can be misleading with unbalanced data.
- True — Precision = TP / (TP + FP).
- True — Recall = TP / (TP + FN).
- True — F1 = 2 × (Precision × Recall) / (Precision + Recall).
- True — Missing fraud is typically worse than false alarms.
- False — Never test on training data; use separate test data.
- True — Aravind AI achieved 97.5% sensitivity.
D. Definitions – Answers
1. Evaluation (in AI): The fifth stage of the AI Project Cycle where we test the trained model on new data to measure performance, understand error types, and decide if it’s ready for deployment.
2. True Positive: When the AI correctly predicts a positive case. Example: A spam filter correctly identifying a spam email, or a disease detector correctly identifying a sick patient.
3. False Positive: When the AI incorrectly predicts positive. The actual case was negative, but AI said positive. Example: Marking a legitimate email as spam (false alarm).
4. True Negative: When the AI correctly predicts a negative case. Example: A spam filter correctly allowing a legitimate email through, or a disease detector correctly clearing a healthy person.
5. False Negative: When the AI incorrectly predicts negative. The actual case was positive, but AI said negative. Example: A spam email getting through to inbox (missed detection).
6. Accuracy: The percentage of correct predictions out of all predictions. Calculated as (TP + TN) / Total. While simple, it can be misleading with unbalanced datasets.
7. Confusion Matrix: A table showing the counts of True Positives, True Negatives, False Positives, and False Negatives. It gives a complete picture of model performance beyond just accuracy.
E. Very Short Answer Questions – Answers
1. What is Evaluation and why important?
Evaluation tests AI models on new data to measure performance before deployment. It’s important because it reveals how well the model generalizes, what errors it makes, and whether it’s ready for real-world use.
2. TP and FP explained:
True Positive: AI says “yes” and reality is “yes.” Example: Spam filter correctly catches spam. False Positive: AI says “yes” but reality is “no.” Example: Spam filter blocks a legitimate email.
3. TN and FN explained:
True Negative: AI says “no” and reality is “no.” Example: Disease test correctly clears healthy person. False Negative: AI says “no” but reality is “yes.” Example: Disease test misses a sick patient.
4. What is confusion matrix?
A confusion matrix is a table showing TP, TN, FP, FN counts. It displays how many predictions were correct vs. wrong, and what types of errors occurred. Essential for understanding performance beyond accuracy.
5. Accuracy calculation and limitations:
Accuracy = (TP + TN) / Total. Limitation: With unbalanced data (99 healthy, 1 sick), saying “all healthy” gives 99% accuracy but misses the important case completely.
6. Precision explained:
Precision = TP / (TP + FP). It measures how many predicted positives were actually correct. Important when false alarms are costly — like blocking legitimate emails or wrongly accusing someone.
7. Recall explained:
Recall = TP / (TP + FN). It measures how many actual positives were caught. Important when missing positives is dangerous — like medical diagnosis or security threats.
8. Why 99% accuracy might be bad:
With unbalanced data like rare diseases (1 in 1000), a model predicting “always healthy” achieves 99.9% accuracy but catches zero actual disease cases — completely useless for its purpose.
9. Precision vs Recall difference:
Precision: Of all positive predictions, how many were right? Recall: Of all actual positives, how many were detected? Precision focuses on prediction quality; Recall focuses on catching all cases.
10. What to do with poor results:
Go back to earlier stages: collect more/better data (Acquisition), improve features (Exploration), try different models (Modelling). Evaluate again. Repeat until performance is acceptable.
F. Long Answer Questions – Answers
1. TP, TN, FP, FN with spam example:
True Positive (TP): Email is actually spam, AI marks it spam — correct detection. True Negative (TN): Email is legitimate, AI allows it — correct clearance. False Positive (FP): Email is legitimate, but AI marks it spam — user misses important email (false alarm). False Negative (FN): Email is spam, but AI allows it — spam reaches inbox (missed detection). Both errors are bad, but FP blocks important communication while FN just adds annoyance.
2. Calculate metrics (40 TP, 30 TN, 10 FP, 20 FN):
Total = 40 + 30 + 10 + 20 = 100
Accuracy = (TP + TN) / Total = (40 + 30) / 100 = 70 / 100 = 70%
Precision = TP / (TP + FP) = 40 / (40 + 10) = 40 / 50 = 80%
Recall = TP / (TP + FN) = 40 / (40 + 20) = 40 / 60 = 66.7%
The model has decent precision but lower recall — missing 1/3 of actual positives.
3. Why accuracy isn’t enough:
With unbalanced data, accuracy misleads. Example: Cancer screening with 1000 patients, 5 have cancer. Model says “no cancer” for everyone: Accuracy = 995/1000 = 99.5%. But it missed ALL 5 cancer patients! Zero recall for the important class. Accuracy hides this failure. We need precision and recall to understand performance on both classes.
4. Precision vs Recall priority:
Prioritize Precision when false alarms are costly: Legal system (convicting innocent is worse than missing guilty), spam filters (blocking important email is worse than some spam). Prioritize Recall when missing positives is dangerous: Medical diagnosis (missing cancer is worse than extra tests), security (missing threats is worse than false alarms). Most critical systems prioritize recall.
5. Evaluation process:
Step 1: Split data into training (70-80%) and test (20-30%) sets — keep test data separate. Step 2: Train model only on training data. Step 3: Run trained model on test data to make predictions. Step 4: Compare predictions to actual labels, count TP/TN/FP/FN. Step 5: Calculate metrics — accuracy, precision, recall, F1. Step 6: Analyze errors for patterns. Step 7: Decide if acceptable; if not, iterate back to improve data or model.
6. Aravind AI evaluation:
The diabetic retinopathy AI achieved 97.5% sensitivity (recall) — catching 97.5% of patients with referable disease. Specificity was 96.1% — correctly clearing 96.1% of healthy eyes. Overall agreement with expert ophthalmologists was 98.6%. High recall was prioritized because missing someone with eye disease could lead to preventable blindness. The evaluation proved AI matched expert performance, justifying deployment to 71 rural vision centers.
7. Common evaluation mistakes:
Testing on training data — model memorizes, doesn’t generalize; use separate test data. Only checking accuracy — hides class imbalance problems; use confusion matrix, precision, recall. Ignoring rare cases — model might fail on important minorities; check performance per class. One-time evaluation — performance varies; use cross-validation. No baseline — unclear if model is actually good; compare to simple benchmarks. Fix by following proper evaluation protocols and examining multiple metrics.
Activity Answers
From the table:
- TP = 30 (Correctly predicted defective)
- TN = 140 (Correctly predicted good)
- FP = 20 (Wrongly predicted defective when actually good)
- FN = 10 (Wrongly predicted good when actually defective)
Accuracy = (30 + 140) / 200 = 170/200 = 85%
Precision = 30 / (30 + 20) = 30/50 = 60%
Recall = 30 / (30 + 10) = 30/40 = 75%
Analysis: The model is 85% accurate overall, but only 60% of items it flags as defective are actually defective (low precision). It catches 75% of actually defective items (moderate recall). The model generates many false alarms.
Next Lesson: AI Deployment: How to Launch and Use Your AI Solution in Real Life
Previous Lesson: AI Modelling Explained: Rule-Based vs Learning-Based Approach (With Examples)